|
The Physics of FLO
Dave Tutelman -- January
2, 2008
• Why is FLO[1]
important?
Because it is the most simple and direct measure of the real direction
of the spine and NBP.
• Why does a "spiny" shaft
wobble when plucked? Because the spring forces due to
bending the shaft are not in the same direction as the bend itself.
This article explores the above questions, with illustrations,
analysis, and even some math -- sorry 'bout that to those of you who
are trigonometriphobes.
Here are the topics we'll cover:
- Some basics of
how a shaft's stiffness varies with direction.
- Don Johnson's "shaft art",
which shows exact trajectories of shaft wobble.
- A few similar phenomena: Lissajous
patterns on oscilloscopes, and the Y-pendulum
-- an experiment you can do.
- The equations
of shaft art -- they're remarkably simple and fit easily on a spreadsheet.
- Why shafts wobble
in the first place, and how much they wobble.
The Basics
Let's start with a functional description of a golf shaft in engineers'
terms, not golfers' nor clubmakers' terms.
A shaft is a spring.
This is very
basic, but it has a number of implication that are important to
understanding FLO:
- Since
the shaft is a spring, it responds to being deformed by exerting a
"restoring force". If you deflect a shaft with your finger, the shaft
will exert a force on your finger. The force is called a "restoring
force" because it is exerted in a direction to bring the shaft back to
straight. (Well, almost. We'll see why "almost" toward the end of this
article.)
- That restoring force is proportional to (a) the
amount of deflection, and (b) the stiffness of the shaft. This is true
of all springs. Mathematically, engineers talk about it as F=-Kx,
where F is
the force, x
is the amount of deflection, the minus sign is because the force is in the opposite direction from the deflection, and K
is the "spring constant" of the spring; in the case of a golf shaft, K
is a numerical representation of the stiffness. Yes, we all know that
frequency is also a numerical representation of stiffness. K is a little
different; instead of cpm, it is expressed in pounds per inch of deflection
(or newtons per centimeter, or other units of "force per distance").
The shaft is not only a spring; more specifically, it
is a flexible beam.
Note that I didn't say, "Perfectly symmetrical flexible beam." We're
talking about spine and FLO here, so we are exploring what happens when
the cross-section of the beam is not
symmetrical. That leads us to a few more facts that engineers know
about flexible beams, even asymmetrical beams:
 If
you deflect the shaft and measure the spring constant (the stiffness),
then deflect it in exactly the opposite direction (that is, exactly
180º away), you will get the same spring constant. It is equally stiff
in both directions. If
you deflect the shaft and measure the spring constant (the stiffness),
then deflect it in exactly the opposite direction (that is, exactly
180º away), you will get the same spring constant. It is equally stiff
in both directions.- If the cross-section of the beam is not perfectly
symmetrical, then the beam may have a strong plane (the
direction of highest spring constant) and a weak plane (the
direction of lowest spring constant). Clubmakers refer to the strong
plane as the spine
and the weak plane as the Natural Bending Position (NBP) -- or at least
they should if they are using the right measuring instruments.
Repeating that as a table, for clarity:
| Strong
plane |
Weak plane |
Direction
of
highest spring constant |
Direction
of
lowest spring constant |
| Spine |
NBP |
- The strong plane and the weak plane are 90º apart.
- Between the strong plane and the weak plane, the
spring constant varies as an ellipse, as the diagram shows.
- If
the shaft were perfectly symmetrical, then the ellipse would be a
circle, and the spring constant would be the same in every direction.
That would be a shaft with no spine.
These rules are true no
matter how asymmetrical the shaft. You could weld a steel
rod to one side of the shaft, and the rules would still be true. I'm
not going to
explain here why this should be. But it has been well known to those
studying structures for a long time. I have even found a mathematical
proof of it in Timoshenko's classical mechanics book[2],
which was written in 1930.
Before we go any further, let's state some assumptions underlying the rest of the work:
- Whatever
asymmetrical stiffness the shaft has, it is the same (including its
orientation) for the length of the shaft. (It turns out that this isn't
a major restriction, but it's hard to show that fact so I won't bother.)
- The
shaft, when flexed either for "shaft art" or by a golf swing, remains a
linear spring. Almost every spring material and spring design has some
level of deflection where F=-Kx fails. We assume that this doesn't happen to our shaft in normal operation.
 One
final "basic". Let's look at how a shaft oscillates when there is
a spine -- how it gets from a planar up-down vibration to an
out-of-plane oval. Here is a video example, using a shaft with a really
substantial spine. One
final "basic". Let's look at how a shaft oscillates when there is
a spine -- how it gets from a planar up-down vibration to an
out-of-plane oval. Here is a video example, using a shaft with a really
substantial spine.
|
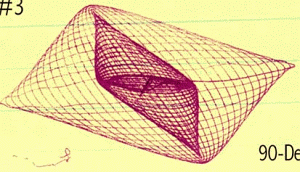
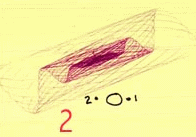
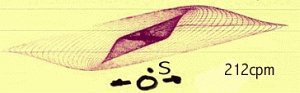
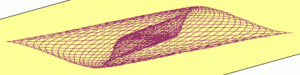
Shaft Art
Sometime
around 2001, something happened to me that really clarified FLO in my
mind -- what it was and what it meant. Don Johnson of BTM Clubs sent me
some graphs that he had made. Rather, some shafts made the graphs for
him, their tips tracing out a pattern as they wobbled. They looked
original and attractive, so he called them "Shaft Art", which certainly
seemed appropriate.
Here's a sampling of some representative shaft art from Don's
collection. (Thanks, Don.)
ProLite 3-iron shaft |
ProLite 8-iron shaft |
AJ Tech shaft |
AJ Tech shaft (two different plucks) |
Aldila VL-1 |
Quadrax shaft |
The pictures show the path of the shaft tip after it is plucked, when
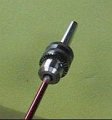
clamped at the butt and weighted at the tip. (Think of taking a
frequency measurement, or looking for FLO.) Don made the pictures by
attaching a pen to the tip
of the shaft; the pen was the instrumentation pen from a
Hewlett-Packard plotter[3].
The paper
was 3M Post-It notepaper, suspended by its sticky edge to minimize the
friction. (Today, you'd probably use a laser pointer attached to the
tip weight, and a camera to take a time exposure of the laser's trail.
The resulting picture would be the same.)
My reaction the instant I saw them was, "Hey, I know what that is! I've
seen it before, a long time ago."
Oscilloscopes and
Lissajous Patterns
Around 1960, when I was an undergraduate Electrical Engineering student
at CCNY, I saw patterns like that in the electrical measurement lab at
school. I viewed the patterns on an
oscilloscope screen, and knew them as Lissajous patterns.
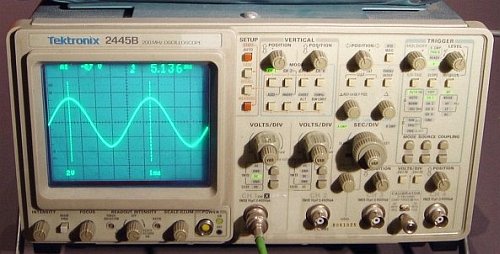
This is an oscilloscope, an instrument whose purpose is to visually
display electrical waveforms. Normally it is used as shown in the
picture, displaying an amplitude (usually voltage) vs time. In other
words, it displays a graph whose horizontal axis is time, and whose
vertical axis is voltage. In the
picture, the voltage is a "sine wave" -- which happens to be the same
shape as a clamped shaft's
motion vs time.
But there is another mode in which you can use an
oscilloscope. You can display one waveform on the horizontal axis, and
another on the vertical axis. 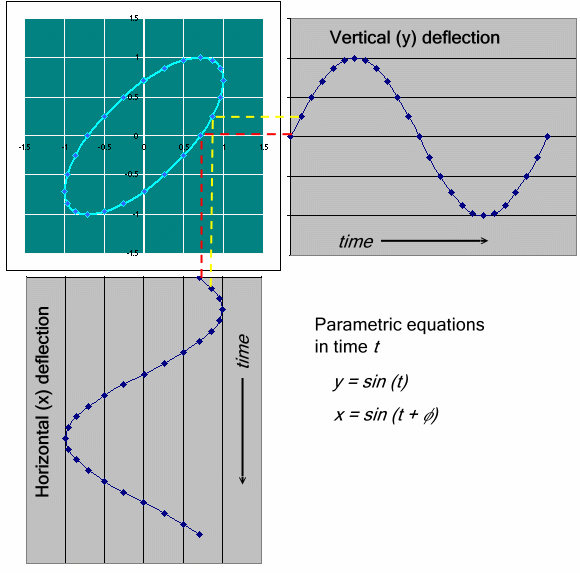 This is useful when you want to
compare the frequencies of two waveforms. (Yeah, I know. Use a
frequency counter. That's how it would be done today. But frequency
counters were expensive and relatively rare in 1960,
while every electronics lab had oscilloscopes.[4]) This is useful when you want to
compare the frequencies of two waveforms. (Yeah, I know. Use a
frequency counter. That's how it would be done today. But frequency
counters were expensive and relatively rare in 1960,
while every electronics lab had oscilloscopes.[4])
Here is how it works. The example shows two sine waves of the same
frequency, but "out of phase" with each other. (Out of phase means the
waves do not reach their peaks at the same time.) As one wave generates
the vertical deflection on the instrument's screen, the other wave
generates the horizontal deflection -- instead of a time base for
horizontal.
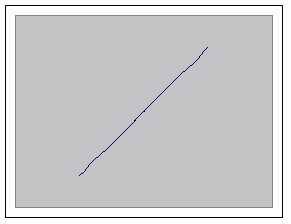
As the figure shows, the result is an ellipse of some sort. If the
waves are perfectly in phase, the image is a diagonal straight line,
and "ellipse" with no width. If the waves are 180º out of phase, then
you get a diagonal line in the other direction. And if they are 90º out
of phase, the result is a circle.
Mathematically, we are looking at a plot of two "parametric equations".
You use parametric equations when it is hard to write an equation of x vs y, but you can
write both x
and y in
terms of some other variable -- like time t. Both the
horizontal (x)
and vertical (y)
waveforms are relatively simple functions of time, along with a
constant phase angle φ.
If φ=0,
then the waves are in phase, otherwise they are out of phase.
|
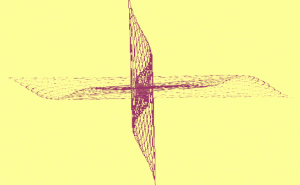
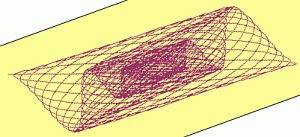
 So,
if the frequencies are the same, you get some kind of ellipse. But what
happens if they are not the same? If they are far apart, then you get a
very interesting swirly pattern, that it takes some experience to
understand. But, for a clubmaker trying to understand FLO, the most
interesting case is when the horizontal and vertical waveforms have
almost the same frequency -- but not quite the same. When that happens,
it looks like a same-frequency ellipse, except that the phase keeps
changing because of the slight difference in frequency. The ellipse
keeps morphing on the screen, like the animated picture here. So,
if the frequencies are the same, you get some kind of ellipse. But what
happens if they are not the same? If they are far apart, then you get a
very interesting swirly pattern, that it takes some experience to
understand. But, for a clubmaker trying to understand FLO, the most
interesting case is when the horizontal and vertical waveforms have
almost the same frequency -- but not quite the same. When that happens,
it looks like a same-frequency ellipse, except that the phase keeps
changing because of the slight difference in frequency. The ellipse
keeps morphing on the screen, like the animated picture here.
Look
familiar? Doesn't it look like a shaft with a lot of spine and no
damping (so it doesn't lose amplitude), when plucked in a
non-FLO direction? That isn't just a coincidence. As soon as I saw
Don's shaft art, I realized that shaft wobble due to spine is
mathematically the same thing as a Lissajous figure on an oscilloscope
screen. And since the Lissajous pattern has remarkably simple equations
defining its motion, shaft wobble is pretty simple too -- in
spite
of its seeming visual complexity. |
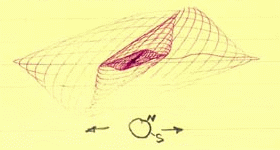
The Y-Pendulum
As a college sophomore, I thought Lissajous figures were really cool.[5]
I
wanted to play with them, just for the visual experience. But I didn't
get my own oscilloscope for home until my junior year, when I built
one. So I had to find another way to play with them.
 I built a pendulum with two
frequencies, one frequency in one direction
and another frequency perpendicular to that direction. How can we do
that? We make the shape of the pendulum a "Y", as in the picture. The
three arms of the Y are string tied together. The pendulum is suspended
at two points (instead of the usual one), and there is a weighted bob
to provide the mass. I built a pendulum with two
frequencies, one frequency in one direction
and another frequency perpendicular to that direction. How can we do
that? We make the shape of the pendulum a "Y", as in the picture. The
three arms of the Y are string tied together. The pendulum is suspended
at two points (instead of the usual one), and there is a weighted bob
to provide the mass.
We
all know that the frequency of a pendulum is dependent on its length.
But the Y-pendulum has two different lengths: in the plane of the Y,
only the bottom portion can swing, so the length is shorter -- and thus
the frequency is higher.
Make one for yourself, it's certainly
easy enough. Try to have the bottom arm of the Y at least 3/4 of the
total height of the pendulum. Somewhere around 80-85% is ideal. Now you
can play with it to confirm the following behaviors:
- If you release it to swing exactly in the plane of
the Y (shown in red),
it will swing back and forth with no wobble.
- If you release it to swing perpendicular to the plane
of the Y (shown in green),
it will swing back and forth with no wobble -- but at a slightly lower
frequency (longer period) than it did in the plane of the Y.
- If
you release it in any other direction, it will wobble. It will oval out
into an ellipse, then settle into a straight line (but different from
the original release). But it won't stay there. It will oval again,
then return to a straight line like the original release. It behaves
just like the animated oval in the previous section. It will
continue this oval-straight alternation until the small friction in the
string and air resistance bring it to a halt.
This is exactly
the behavior of a clamped shaft with a spine. Don's shaft art can be
duplicated by a Y-pendulum with proper parameters. (Those parameters
would include damping as well as frequency and the initial angle of
release.)
So what did I do with my Y-pendulum in 1960? I made it
with a flashlight as the bob. I set my camera for time exposure,
pointed it upward from below the pendulum, and photographed enough
swings to get an interesting Lissajous pattern. The important result
is... a lot of those photos looked
very much like Don's shaft art. As I said, I've seen this
before -- over forty years ago. |
Testing the
Theory -- A Shaft-Art
Spreadsheet
It's one thing to say that Don's shaft art looks like a Lissajous
pattern. It's quite another to prove that it is
a Lissajous pattern. Can we make that leap? Let's try.
I have come up with an Excel spreadsheet to generate Lissajous
patterns. It is based on the simple parametric equations above, plus a
damping factor so the oscillations decay as a real shaft's will. (You
can download
a copy of the spreadsheet to play with yourself.) Using it, I have
duplicated enough of
Don's shaft art that I am convinced that is what we are looking at.
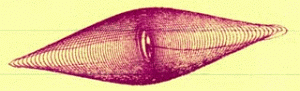
Here's a sample of shaft art and the corresponding Lissajous pattern.
Shaft art - ProLite
3-iron |

Lissajous Pattern
Freq. ratio = 1.03, increment = 12.8º,
decay = .0015 |
Impressed? I am. We'll see more below. But first let's see what
underlies
the spreadsheet.
As
we saw before, the horizontal and vertical axes are parametric
equations with time as the common parameter. Each equation is a sine
wave, with the following details needing to be filled in:
- Frequency.
Actually, all we need is the ratio between the horizontal and vertical
frequencies. To give a feel for this, consider a driver shaft whose
frequency is 250cpm. If the size of the spine is 10cpm (that is, the
difference between the spine and NBP frequencies is 10cpm), then the
frequency ratio is 1.04 (that's [250+10]/250).
- Phase.
In order to match arbitrary shaft art, the spreadsheet supports a phase
angle for both horizontal and vertical sine waves. By the way, a pure
"pluck" of a shaft has both x
and y
starting at a phase of 90º. In
order to keep the default phase at 0º
(an aesthetic choice, not a mathematical necessity), we use cosine
instead of sine -- because cosine is a sine wave that starts at 90º.
- Amplitude.
Horizontal and vertical amplitudes must obviously be adjusted to match
the aspect ratio of the shaft art. Although I have included amplitude
parameters,
Excel automatically scales graphs -- so changing the amplitude does not
change the graph. For the graphs I show, I adjusted the
amplitude by sizing the graph after it was produced.
- Decay.
A shaft has internal friction, so the oscillations are damped out over
time. That is, the vibrations "decay" at some rate. The way we handle
this in the spreadsheet is to multiply the amplitude each sample by a
number less than 1.0 in order to get the next sample. The "decay"
variable is a small number indicating how rapidly the vibrations damp
out. Example: if the decay variable is .0013, then the amplitude of
each sample is multiplied by (1-.0013) to get the next sample. This
gives the sort of exponential decay that corresponds to physical
reality.
- Time
window.
How long do we run the simulation? How many cycles of vibration are in
the shaft art we are trying to simulate? We control this in the
spreadsheet by dividing the 1000 points we compute into degrees. For
instance, if we want to simulate 40 cycles, then each cycle is
represented by 25 points on the graph. So the step-to-step increment is
14.4º=360º/25.
- Orientation.
Don's shaft art is oriented however Don had the shaft and the paper for
that run.
The spreadsheet is restricted to having the FLO planes horizontal and
vertical. I used my favorite graphics program (ULead PhotoImpact) to
rotate the graphs so they are oriented as Don's shaft art is. I didn't
try to hide the rotation; that's why some of the Lissajous patterns
show slanted borders in the corners.
Ultimately, the equations driving the spreadsheet look like:
x =
Ax e-Dxt
cos (fx t + φx)
y
= Ay e-Dyt
cos (fy t + φy)
where:
y = vertical distance on
graph.
x = horizontal distance on graph.
t = time.
A = amplitude.
D = decay rate, which is related to the decay variable in the
spreadsheet.
fy/fx = frequency ratio.
φ = phase.
These
are remarkably simple equations for something as complex as shaft spine
or as complex-looking as shaft art. You may not think so if you are
afflicted with trigonometriphobia but, as mathematical models of the
real world go, it doesn't get much easier than this.
Now let's see some more shaft art and how the spreadsheet duplicates it.
| Shaft
Art |
Lissajous
Pattern |
ProLite 8-iron shaft |

Freq. ratio = 1.01, increment = 16º,
decay = .0018, phasey = 6º |
AJ Tech shaft |

Freq. ratio = 0.955, increment = 13º,
decay = .0035,.0015 |
AJ Tech shaft (two different plucks) |
Same as above, but two plucks superimposed,
one near spine and one near NBP |
Aldila VL-1 |
Freq. ratio = 1.045, increment = 18º,
decay = .0018,.0016 |
Quadrax shaft |
Freq. ratio = 1.025, increment = 16º,
decay = .002 |
This is a remarkable match, given such a simple mathematical model and
such intricate real-world data.
Whys and Wherefores
of Shaft Wobble
But first, a few
words about science...
What we have here is, as a scientist would say, a theory that passes
the data test. Before we continue investigating what we can learn from
this theory, I'd like to put the word "theory" into proper context.[6]
The two most important concepts in science are theory and law. These words
have very specific meanings in a scientific context, so perhaps it's
unfortunate that they also have meaning in everyday context. Here's
what a scientist means:
- A law
of science is a reliable, repeatable observation. It is a
generalization about observed data. Example: "The sun rises and sets once for
each 24-hour period," is a law. We observe that to be true
over and over again. We have never observed it to be false, so it's a
very solidly entrenched law.
- A theory
is an explanation for an observed law or, even better, for a set of
related laws. Example:
Let's look at theories for the law we just mentioned. From the
beginning of science up until a few hundred years ago, the prevailing
theory to explain the sun's rising and setting was, "The sun revolves in an orbit
around the earth." But, as more obervations were made --
many by astronomers in the era of Copernicus and Galileo -- it became
clear that a different explanation better fit all the data, not just
the sun's rising and setting: "The
earth rotates on its axis, and causes the sun to appear to move."
That theory supplanted the old theory, and remains the explanation to
this day.
That is the scientific method in a nutshell! There's a lot of
additional detail you need to know to practice, to understand, or to
criticize scientific work, but first and foremost you have to
understand this relation between theory and law. Laws are directly
observed phenomena; theories are explanations of laws. Where competing
theories exist to explain the same laws, the "correct" theory is
selected on the basis of simplicity, consistency with more laws, and
its ability to correctly predict observations that have not yet been
made but can be tried.
So the next time you hear someone say, "Well, that's just a theory!" to
put down an idea, remember what "theory" really means. Any
scientific explanation is "just a theory"... because
that's what a theory is. But some theories have stood the test of data,
and are accepted by science as fact -- at least until a better theory
comes along. And "better" means simpler, more consistent with observed
data, and better able to predict new laws.
Now back to our regular programming...
How does this apply to FLO and shaft art?
I have postulated a theory about the behavior of unsymmetrical golf
shafts:
Unsymmetrical golf shafts behave
as a pair of springs at right angles to each other, one on the strong
axis of the shaft and the other on the weak axis.
Don's shaft art is data. Collectively, we can think of it as a law of
science, a set of data that any of us can duplicate.
My theory is sufficiently simple that we can mathematically model the
vibrating shafts. I have done so. The
mathematical model is able to create the same shaft art that Don
observed. So -- at least for the data we have on hand -- the theory
appears to be valid. Let's treat it as valid, and see what it teaches
us about shaft behavior.
Here are two important lessons if the theory is correct:
- FLO is a reliable way to determine the strong and weak
planes of a shaft.
- If a shaft is bent in a plane other than the strong or weak
plane, then the restoring force of the spring will not be in the
direction of the bend.
Let's look at these in more detail...
Finding spines
FLO is a reliable way to
determine the strong and weak planes of a shaft.
How do we know this is true?
Because it follows from the theory. If the shaft behaves like two
independent springs at right angles, then the vibration is the sum of
what the two springs would produce independently. As we saw from the
equations, that motion consists two sine waves. And the result cannot
be a straight line (FLO) unless one of the following is true:
- The frequencies are the same. (In other words, the "strong"
and "weak" planes have the same spring constant, so the shaft has no
spine.)
- The oscillation is exactly in the strong plane (the spine
plane). This is true because the weak plane spring -- with a different
frequency -- is never stretched, so it never contributes to the motion.
- The oscillation is exactly in the weak plane (the NBP
plane). Same reasoning.
If you don't want to deal with the math, then play with a Y-pendulum.
We have shown that its motion has the same physical model as a
vibrating shaft. And it only swings in a straight line (a) in the plane
of the "Y", (b) perpendicular to the "Y", or (c) if the pendulum is a
single string (no "Y", same period in all directions).
Why is this important?
Because conventional, bearing-based spine finders are not a reliable way to
find a spine.
They are thrown off by any residual bend in the shaft. If the shaft is
very straight and has a lot of spine, then they will give the right
answer. But, for most shafts, the residual bend is enough to partially
mask a modest spine, and the spine-finder gives the wrong direction.
Now you know a way to find the spine reliably. Just find the planes of
FLO. They will be the spine and the NBP.
If you have a frequency meter setup in your shop, you already have the
equipment. The higher-frequency FLO plane is the spine, and the lower
frequency the NBP.
Even if you don't have a frequency meter, a solid clamp for the shaft
butt will do. (It must be solid enough so that neither the clamp nor
the bench on which it is mounted vibrate along with the shaft.) Now you
can find the two FLO planes. Distinguishing which of these planes is
the strong plane
and which is the weak one can sometimes be deduced with the aid of the
bearing-based spine finder.
Out-of-plane spring force
If a shaft is bent in a
plane other than the strong or weak plane, then
the restoring force of the spring will not be in the direction of the
bend.
When you deflect a spring, the restoring force is generally in exactly
the opposite direction to the deflection. So, when you bend a shaft at
the tip, the restoring force should be in exactly the opposite
direction to the bend. Right? Well almost. Without spines, the answer
would be correct. But now we have a mathematical model for the spine;
let's use it to see what the restoring force looks like.
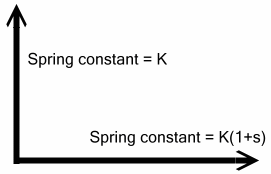 First let's specify the model of
the shaft. It consists of two springs, one on the weak axis (or NBP)
and the other on the strong axis (or spine). In the picture, the NBP is
vertical and the spine is horizontal. First let's specify the model of
the shaft. It consists of two springs, one on the weak axis (or NBP)
and the other on the strong axis (or spine). In the picture, the NBP is
vertical and the spine is horizontal.
Each spring has its own spring constant. Usually the spring constants
would be called K1 and K2,
or maybe Kx and Ky. But
it turns out that the ratio of the spring constants is what we're
really interested in, and that ratio is very close to one in the case
of shaft spine. So let's refer to the spring constants as K for the NBP
and K(1+s) for the spine.
|
 Now what happens when we bend
the shaft? That depends on which direction we bend it. Now what happens when we bend
the shaft? That depends on which direction we bend it.
- If we bend it vertically, then there is a simple
restoring force -Kx1
- If we bend it horizontally, there there is a simple
restoring force -K(1+s)x2
- If we bend it in any other direction, then both
springs get into the action. We need to analyze that case more
carefully.
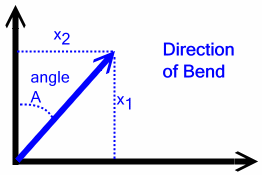
Suppose we bend the shaft as an angle A to the NBP. Then the amount of
bend on each axis is x1 and x2,
where
|
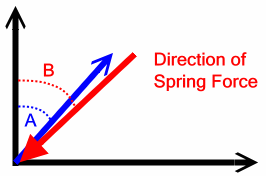 How about the angle of the
restoring force? It will be the resultant of two spring forces at right
angles to one another. How about the angle of the
restoring force? It will be the resultant of two spring forces at right
angles to one another.
- The vertical force is -Kx1
- The horizontal force is -K(1+s)x2
The resultant force B (shown in red in the diagram) is not necessarily
at the same angle as the bend angle A. The formula for B is:
| tan(B) = |
-K(1+s)x2
-Kx1 |
= (1+s) |
x2
x1 |
|
 So
the force (B) is always a little closer to the spine than the bend
itself (A). The difference angle (B-A), the angle between the bend and
the spring force that results, can be
computed without too much trouble: So
the force (B) is always a little closer to the spine than the bend
itself (A). The difference angle (B-A), the angle between the bend and
the spring force that results, can be
computed without too much trouble:
| tan(B-A) = |
s tan(A)
1
+ (1+s) tan2(A) |
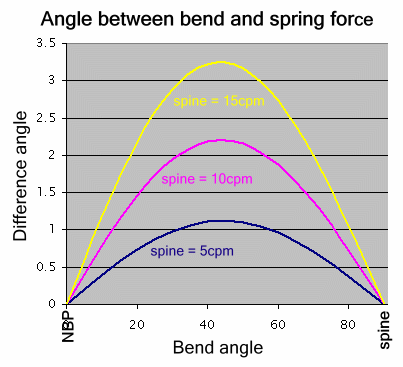
That is just a function of s and the angle the bend is off from the
NBP. Here is a plot of that function for s=.04, .08, and .12. For a
shaft with a 250cpm frequency at the NBP, that corresponds to spines of
5cpm, 10cpm, and 15cpm.[7]
Conclusions about wobble
What does this
mean in practical terms? Here are a few interesting
conclusions:
- A swing
that generates only in-plane bending can still create forces that throw
the clubhead out-of-plane. That's because, if the bend is
not in a FLO plane, the force is not in the same direction as the bend.
- If
out-of-plane forces are the thing that causes a misaligned shaft to
result in a bad club, then the size of the spine matters.
Look at the graph. For a 5cpm spine, the difference angle never gets
bigger than 1.12º. For a 15cpm spine, the difference angle exceeds
1.12º if the shaft bend is more than 8º from one of the FLO planes. So
a 15cpm spine, if not aligned "properly" (whatever that means) to
within 8º, is at least as bad as a 5cpm spine that hasn't been aligned
at all -- and probably quite a bit worse.
Early
tests by SST PURE in the 1990s determined that misaligned shafts
resulted in a bigger variation in the impact spot on the clubface. If
that is the main problem with misaligned shafts, then the out-of-plane
force is probably a big part of that problem. So, if those early tests
really reflect the need for spining, you have just learned why in this
article. A misaligned shaft will result in out-of-plane forces that
cause the clubhead to move out-of-plane during the downswing.
But we don't know for sure that this is the problem with spines. There
are quite a few theories
about what causes misaligned shafts to result in bad clubs. So not all
the returns are in yet. But one thing at we do know: FLO is one of the
most reliable ways to find the spine of a shaft.
|
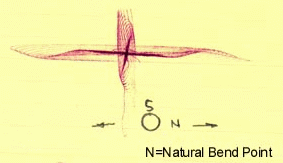
Notes:
- FLO is short for Flat Line Oscillation.
It refers to the way a clamped shaft vibrates. If you clamp the butt of
a shaft and put a weight (or a clubhead) at the tip, you will get some
pattern to the vibration. Either the tip will oscillate back and forth
in a straight line (FLO), or it will wobble out of plane (non-FLO).
- S. Timoshenko, "Strength
of Materials - Part I", D. Van Nostrand, 1930, Appendices,
esp. App V.
- I
have a soft spot in my heart for the H-P flatbed plotter. Back in 1970,
it was involved in my first foray into mixing computers, technology,
and sports. I was sailing competitively at the time, in the Albacore
one-design sailboat. I used a computer to determine the cross-section
of the optimum centerboard, and made the centerboard it specified. The
link between numbers and reality was a set of templates, printed by
computer using the H-P plotter. Nobody won a major Albacore
championship for the next couple of years without first borrowing those
templates and building a new centerboard from them.
- Funny story
about that! In the early 1970s, I
was the manager of an electronics research group in a large telecom
company. In planning our annual budgets, it was always hard to convince
upper management that we needed newfangled stuff. But nobody ever
questioned allocating funds for a half-dozen more oscilloscopes, even
though you couldn't walk through the lab without bumping into a few and
without pushing other 'scopes aside. So that's how I always got my
"discretionary" budget for next year. I'd budget the dollars for
oscilloscopes, and then spend on what my group really needed.
- Shaft
art is certainly a visually pleasing kind of pattern. But, if you want
to know just how cool Lissajous figures can be, download the
spreadsheet and try larger frequency ratios than you're likely to find
on the spine of a shaft. For instance, set the increment to 10º and the
decay to .0015, then try:
- Frequency ratio = 3, phase = 45º
- Frequency ratio = 1.25, phase = 0º
- Frequency ratio = 4, phase = 30º
- Frequency ratio = 1.333, phase = 22.5º, decay = .0005
- I'll take this
opportunity to thank Dr.
Lawrence Podell for spending a month drumming this into my
head. At the time (1958), I was a freshman in the engineering school at
the City College of New York, and he was a fairly junior professor
there. He must have been pretty junior, because he was teaching a
social studies course for engineers. Junior or not, he was my first
teacher who actually met my expectations of what a college professor
should be, and he gave me what is still my most comprehensive education
about what
science is.
- The curve of
the angle between the bend and the restoring
force looks to the eye like a sine curve, specifically
(B-A) = 27 s sin(2A)
This is a pretty good approximation for small values of s.
It gets a little
out of hand at about s=.25,
where the spring constant is 25% greater at the NBP than at the spine.
That corresponds to a whopping spine of 30cpm on a 250cpm shaft. Bet
you've never seen a spine that big. So feel free to use the approximate
formula.
Last modified 3/22/2008
|
